A new paper in the Economics & Human Biology journal argues that male height in Europe is mostly determined by nutrition and genetics. That's not exactly earth shattering news. However, the authors also point out that Y-chromosome haplogroup I-M170 shows a strong correlation with the highest average stature on the continent, and speculate that the link between the two might be Upper Paleolithic hunter-gatherer ancestry:
The average height of 45 national samples used in our study was 178.3 cm (median 178.5 cm). The average of 42 European countries was 178.3 cm (median 178.4 cm). When weighted by population size, the average height of a young European male can be estimated at 177.6 cm. The geographical comparison of European samples (Fig. 1) shows that above average stature (178+ cm) is typical for Northern/Central Europe and the Western Balkans (the area of the Dinaric Alps). This agrees with observations of 20th century anthropologists (Coon, 1939; Lundman 1977). At present, the tallest nation in Europe (and also in the world) are the Dutch (average male height 183.8 cm), followed by Montenegrins (183.2 cm) and possibly Bosnians (182.5 cm) (Table 1). In contrast with these high values, the shortest men in Europe can be found in Turkey (173.6 cm), Portugal (173.9 cm), Cyprus (174.6 cm) and in economically underdeveloped nations of the Balkans and former Soviet Union (mainly Albania, Moldova, and the Caucasian republics).
...
The trend of increasing height has already stopped in Norway, Denmark, the Netherlands, Slovakia and Germany. In Norway, military statistics date its cessation to late 1980s.
...
In contrast, the fastest pace of the height increase (≥1 cm/decade) can be observed in Ireland, Portugal, Spain, Latvia, Belarus, Poland, Bosnia and Herzegovina, Croatia, Greece, Turkey and at least in the southern parts of Italy.
...
Although the documented differences in male stature in European nations can largely be explained by nutrition and other exogenous factors, it is remarkable that the picture in Fig. 1 strikingly resembles the distribution of Y haplogroup I-M170 (Fig. 10a). Apart from a regional anomaly in Sardinia (sub-branch I2a1a-M26), this male genetic lineage has two frequency peaks, from which one is located in Scandinavia and northern Germany (I1-M253 and I2a2-M436), and the second one in the Dinaric Alps in Bosnia and Herzegovina (I2a1b-M423)16. In other words, these are exactly the regions that are characterized by unusual tallness. The correlation between the frequency of I-M170 and male height in 43 European countries (including USA) is indeed highly statistically significant (r = 0.65; p < 0.001) (Fig. 11a, Table 4). Furthermore, frequencies of Paleolithic Y haplogroups in Northeastern Europe are improbably low, being distorted by the genetic drift of N1c-M46, a paternal marker of Ugrofinian hunter-gatherers. After the exclusion of N1c-M46 from the genetic profile of the Baltic states and Finland, the r-value would further slightly rise to 0.67 (p < 0.001). These relationships strongly suggest that extraordinary predispositions for tallness were already present in the Upper Paleolithic groups that had once brought this lineage from the Near East to Europe.

Citation...
Grasgruber et al., The role of nutrition and genetics as key determinants of the positive height trend, Economics & Human Biology, available online 7 August 2014, DOI: 10.1016/j.ehb.2014.07.002
There's been a lot of horseshit published over the years about Y-chromosome haplogroup R1a, which just happens to be my haplogroup. This includes academic papers in journals like PLoS ONE and Nature.
Indeed, a new paper on the phylogeography of R1a appeared at the Nature website today: Underhill et al. 2014. It's actually a much better effort than anything else on the topic at academic level thus far, but certainly not without issues.
For instance, the authors failed to include two well known and very important R1a subclades in their analysis: the Northwest European-specific R1a-CTS4385 and the East and Central European-specific R1a-Z280. As a result, the former is lumped with R1a-M417* and the latter with R1a-Z282*. In fact, Z280 is shown to be above Z282 in the topology of R1a-M420 (see Figure 1 here), which is plain wrong. These are major oversights and mean that this study is not a very useful resource as far as the phylogeography of European R1a is concerned.
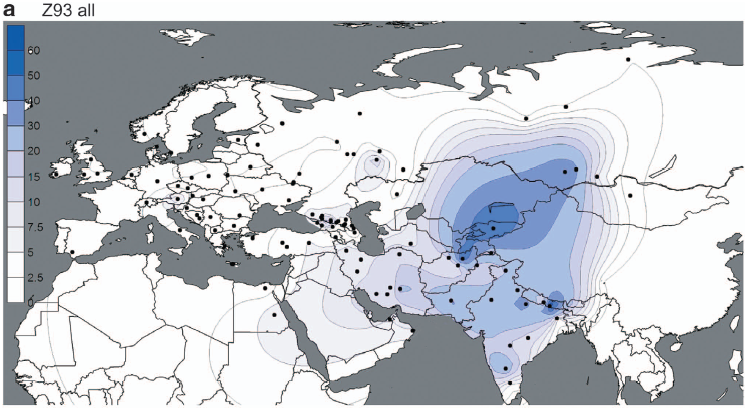
But the paper does show a couple of interesting things. For instance, the maps below offer the best illustration to date of the dichotomy between the European-specific R1a-Z282 and Asian-specific R1a-Z93.
However, these are very closely related subclades, sharing the Z645 mutation (unfortunately not mentioned in the paper), and both reaching high frequencies among Indo-European speakers. It's therefore plausible that groups carrying these markers expanded to the west and east from a zone between their current hotspots, possibly the Volga-Ural region, rather recently.
These migrations had to have happened after 4800-6800 YBP, which is the age of R1a-M417 reported by Underhill et al., and backed up by estimates from genetic genealogists using, among other things, complete R1a sequences (see here). In other words, the rapid expansions of R1a-Z282 and R1a-Z93 appear to have taken place from more or less the same region during the generally accepted early Indo-European timeframe, making them excellent candidates for paternal markers of the early Indo-European dispersals.
At the same time, the paucity of R1a-Z93 and derived lineages in Europe, including Eastern Europe, suggests that historic migrations originating in East and Central Asia, like those of the early Turks, had a negligible effect on the paternal ancestry of modern Europeans. This shows very clearly on the PCA in Figure 4 (see here).
Citation...
Underhill et al., The phylogenetic and geographic structure of Y-chromosome haplogroup R1a, European Journal of Human Genetics, advance online publication, 26 March 2014; doi:10.1038/ejhg.2014.50
See also...
The beast among Y-haplogroups
Over at Nature Communications, Rootsi et al. report on a newly discovered Ashkenazi-specific subclade of R1a, defined by the M582 mutation. They argue that it's a marker of Near Eastern origin, and based on the comprehensive data in their paper, I'd say they're correct. However, it's important to note that this doesn't preclude an ultimate Eastern European or Central Asian source of M582 in the Near East. For instance, an R1a mutation ancestral to M582 might have been introduced by the proto-Iranians from the steppe into what is now Iran during the early Indo-European dispersals. Indeed, that's actually what Figure 1a from the study suggests (phylogenetic tree of R1a below). The paper is open access, but here are a few quotes anyway:
Haplogroup R1a-M582 was only sporadically observed in Europe, the Diaspora residence of Ashkenazi Jews. Notably, it was not identified among 2,149 samples (including 922 R1a-M198) of non-Jews from East Europe, where the Ashkenazi Jewish community flourished in recent centuries (Table 1).
...
Within 1,068 West/North European samples (106 R1a-M198), M582 was observed in just one German sample, and among 3,756 Central/South European samples (710 R1a-M198), it was found only in one Hungarian and one Slovakian sample (Table 1).
...
Among 3,739 Near Eastern samples (303 R1a-M198), R1a-M582 was identified in various populations, with the highest frequency occurring within Iranians collected from the southeastern Kerman population who self-identified as Persians, northwestern Iranian Azeri and in Cilician Anatolian Kurds, at 2.86%, 2.50% and 2.83%, respectively (Table 1). In contrast, among 2,164 samples from the Caucasus (211 R1a-M198), R1a-M582 was found in just one Nogay sample (Table 1).
...
Considering the historical records of Ashkenazi Jews, three potential geographic sources should be considered: the Near East, which was the geographic location for the ancient Hebrews; Europe, which was the residence of the Ashkenazi Jewish Diaspora and the region in which they evolved for nearly two millennia; and the region overlapping with the no longer extant mid-11th Century Khazarian Khaganate, whose ruling class has been suggested to have converted to Judaism [18]. Our data render the latter source highly unlikely since the Khazarian Khaganate overlapped with the Northern Pontic-Caspian steppe and the North Caucasus region, in which just one Nogay sample carried the R1a-M582 haplogroup (Table 1). Furthermore, the Nogays, formerly a powerful Kipchak Turkic-speaking nomadic confederation, are relatively recent inhabitants of the Caucasus, and the STR haplotype of the sole R1a-M582 Nogay sample lies outside of the Levite cluster. Had the Caucasus region been the source for the Ashkenazi modal lineage, we likely would have found R1a-M582 Y-chromosomes in some of its 20 local populations examined in our sample of more than 2,000 Y-chromosomes (Table 1).
...
Near Eastern populations are the only populations in which haplogroup R1a-M582 was found at significant frequencies (Table 1). Moreover, the representative samples displayed substantial diversity even within this geographic region (Fig. 1b). Higher frequencies and diversities often suggest lineage autochthony.

Citation...
Rootsi, S. et al. Phylogenetic applications of whole Y-chromosome sequences and the Near Eastern origin of Ashkenazi Levites. Nat. Commun. 4:2928 doi: 10.1038/ncomms3928 (2013).
See also...
The Poltavka outlier
He was short (<160 cm), probably lactose intolerant, had an exceedingly long melon (cranial index = 72.6), and belonged to mtDNA haplogroup K2a. In other words, he was a typical Neolithic farmer, and clearly different from the average modern-day inhabitant of the North European Plain.
No doubt, his people were largely replaced by newcomers from the east and also west during the frequent population shifts in the region after the Neolithic (see here). However, the stable isotope analysis suggests that he ate a lot of millet, which is known as a typically Slavic cultigen in Europe.
ABSTRACT: In 2007 a ceremonial complex representing the Globular Amphora Culture was discovered in Kowal (the Kuyavia region, Poland). Radiocarbon dating demonstrated that the human remains associated with the complex are of similar antiquity, i.e. 4.105 ± 0.035 conv. and 3.990 ± 0.050 conv. Kyrs. After calibration, this suggests a period between 2850 and 2570 BC (68.2% likelihood), or more specifically, 2870 to 2500 BC (95.4% likelihood). Morphological data indicate that the skeleton belonged to a male who died at 27–35 years of age. The unusual morphology of his hard palate suggests this individual may have had a speech disorder. Stable oxygen isotope values of the individual's teeth are above the locally established oxygen isotope range of precipitation, but due to sample limitations we cannot conclusively say whether the individual is of non-local origin. Stable carbon and nitrogen isotope ratios were analyzed to reconstruct the diet of the studied individual, and show a terrestrial-based diet. Through ancient DNA (aDNA) analysis, the mtDNA haplogroup K2a* and lactose intolerance as evidenced by homozygous C-13910 allele were identified. These aDNA results are the first sequences reported for an individual representing the Globular Amphora Culture, enriching the still modest pool of human genetic data from the Neolithic.

Kozłowski T., Stepańczak B., Laurie J. Reitsama, Osipowicz G., Szostek K., Płoszaj T., Jędryhowska-Dańska K., Pawlyta J., Paluszkiewicz C., Witas H.W. Osteological, chemical and genetic analyses of the human skeleton from a Neolithic site representing the Globular Amphora Culture (Kowal, Kuyavia region, Poland), Anthropologie [In Press]
See also...
Polish "Goths" enjoyed their millet, while Polish "Vikings" did not
One of the most enduring myths or cliches concerning European genetic structure is that Poles carry Mongolian admixture. This claim has been repeated so often that it's now regarded by many as fact, including at academic level. Poles apparently acquired this admixture during Mongol and Turkic raids on Eastern Europe during the Middle Ages.
For a long time it was impossible to verify or debunk such claims due to a lack of genetic data from European and Asian populations at high enough resolution. However, that's no longer a problem. Indeed, I've run a wide range of detailed analyses as part of my Eurogenes Genetic Ancestry Project which have shown that my Polish sample does not carry inflated levels of Asian ancestry relative to other Northern and Central Europeans. But in this post it's probably more useful for me to focus on results from peer-reviewed studies to make my point.
I'll start with a look at genome-wide genetic data (aka. autosomal DNA). The bar plot below was featured in a recent study on genetic substructures in European Russia (1). It shows the results of an ADMIXTURE analysis at K=2 (two ancestral populations assumed) using 52,808 SNP markers, which splits the genomes of the samples into West and East Eurasian components. As you'd expect, these components are modal in Europeans and Han Chinese, respectively. This northern Han Chinese sample from Beijing is certainly a very useful proxy for Mongolians, because the East Eurasian component it creates is basically the same one that peaks in the least admixed Mongolian samples in other studies (for example, see 2).
The lowest levels of the East Eurasian component are carried by Latvians, Poles, Germans, Czechs and Italians. But this looks like noise anyway, because the Chinese carry a reciprocal amount of the West Eurasian component. In other words, it's most likely not a real signal of recent admixture from East Asia, but shared prehistoric Eurasian ancestry. If it's not noise, and actually represents admixture from an East Asian source like the Mongolians, then it's difficult to explain why it appears at a clearly higher level in Italians than Poles.
A couple of the Czechs do carry inflated amounts of the East Eurasian component, and I'd say they're Czech Roma with significant South Asian admixture who weren't removed as outliers from the dataset. It's also worth mentioning that the Komi, Finns and Russians (like the Rus_HGDP sample from Kargopol) show higher levels of this component than the Central Europeans. However, this doesn't necessarily mean they have Mongolian ancestry. Indeed, another study has shown that the Kargopol Russians carry various Siberian-specific components, rather than the type of East Asian influence which makes up the majority of Mongolian genome-wide genetic structure (2).
Moreover, the Mongols never raided North Russia or Finland, where in fact these components peak in Europe today. So the most plausible explanation for the relatively high levels of Siberian admixture there is Finno-Ugric or Uralic ancestry. Indeed, the Finns obviously speak a Finno-Ugric language, and so do some North Russian groups, while many others did until recently.
Below is a different kind of analysis of autosomal DNA. It's a pairwise Fixation Index (Fst) test between 16 global populations based on 129,673 SNPs (3). It includes two East Asian samples, the same Han Chinese set as in the above ADMIXTURE analyses, and a Japanese sample from Tokyo. The results appear to correlate very closely with geography, which suggests that we're basically looking at the effects of isolation-by-distance. Interestingly, the Polish sample from Lodz and Warsaw (Po) is genetically more distant from the Han Chinese (CHB) and Japanese (JPT) than are the Swedes (Sw), Norwegians (No) and Germans (Ge). The differences aren't big, but they're consistent, which means that at the very least these Poles can't be carrying more East Asian ancestry than the Scandinavian and German samples.
Next up is a global Principal Component Analysis (PCA) from the same study, featuring the same samples and markers. Again, it's another way of looking at variation in autosomal DNA, and again the results indicate that Poles don't show any special genome-wide genetic links to East Asians. The Polish samples are sitting close to the top of the European cluster and overlap strongly with other Northern and Central Europeans. Indeed, many of the outliers pulling towards the West African (YRI) and East Asian (CHB + JPT) clusters are French, British and German. These individuals are possibly carrying very recent non-European ancestry due to colonial links between Western Europe and the third world. There are also a considerable number of Russians streaming towards the East Asians, and that's probably due to the Finno-Ugric mediated Siberian influence in North Russia described above.
 It might also be useful to assess the level of West Asian or Near Eastern autosomal admixture in Poland compared to other parts of Europe, because many of the Turkic groups which ended up on the Eastern European steppe were largely of West Asian origin. Therefore, if there was a significant genetic contribution from such groups to the Polish gene pool, then Poles today ought to show inflated affinity to West Asian populations compared to other Central and Northern Europeans. The simple answer is that they don't, which can be clearly seen on the pairwise Fst clustering analysis below based on approximately 101,000 SNPs (4).
Y-chromosome or paternal markers tell the same story as autosomal DNA. The most common Y-DNA haplogroup in Poland is R1a1a, making up about 50% of all the Y-chromosome lineages in the country. Based on academic and commercial testing of hundreds of Polish samples to date, it's safe to say that the most dominant subclades of this Eurasian haplogroup in Poland are the European-specific R-M458 and R-Z280 (5, 6). These subclades are closely related to the Scandinavian-specific R-Z284, because all three markers come off the Z283 branch of the R1a1a haplotree. The Z283 mutation is also mostly confined to Europe and possibly originated there.
The main Asian-specific subclade of R1a1a, known as R-Z94, appears to be extremely rare in Poland. This is the subclade that makes up the main share of the R1a1a in Mongolian and Turkic populations of Central Asia, as well as in South Asians. However, even the very few R-Z94 cases among Poles are more closely related to Ashkenazi lineages than those of Mongolians or Central Asians. What all of this means, of course, is that Mongolian or Turkic paternal ancestry isn't "hiding" in Poland under all that R1a1a.
The most common Y-DNA haplogroup among Mongolians and their close ethnic kin is C3. There's actually a particular lineage of C3 called the "star-cluster chromosome" which pops up regularly in purported descendents of the infamous Mongolian warlord Genghis Khan. This might mean that it's a marker of paternal ancestry from Genghis himself, which has been suggested in several academic papers (7, 8, 9). In any case, the haplotype is considered to be very young, probably less than 1000 years, and widespread in areas of Asia where the Mongol hordes were most active during the early Middle Ages. Therefore, it seems to be an excellent signal of Mongolian genetic influence from this key period. Below is a map of its frequencies in a variety of Asian groups.
It might also be useful to assess the level of West Asian or Near Eastern autosomal admixture in Poland compared to other parts of Europe, because many of the Turkic groups which ended up on the Eastern European steppe were largely of West Asian origin. Therefore, if there was a significant genetic contribution from such groups to the Polish gene pool, then Poles today ought to show inflated affinity to West Asian populations compared to other Central and Northern Europeans. The simple answer is that they don't, which can be clearly seen on the pairwise Fst clustering analysis below based on approximately 101,000 SNPs (4).
Y-chromosome or paternal markers tell the same story as autosomal DNA. The most common Y-DNA haplogroup in Poland is R1a1a, making up about 50% of all the Y-chromosome lineages in the country. Based on academic and commercial testing of hundreds of Polish samples to date, it's safe to say that the most dominant subclades of this Eurasian haplogroup in Poland are the European-specific R-M458 and R-Z280 (5, 6). These subclades are closely related to the Scandinavian-specific R-Z284, because all three markers come off the Z283 branch of the R1a1a haplotree. The Z283 mutation is also mostly confined to Europe and possibly originated there.
The main Asian-specific subclade of R1a1a, known as R-Z94, appears to be extremely rare in Poland. This is the subclade that makes up the main share of the R1a1a in Mongolian and Turkic populations of Central Asia, as well as in South Asians. However, even the very few R-Z94 cases among Poles are more closely related to Ashkenazi lineages than those of Mongolians or Central Asians. What all of this means, of course, is that Mongolian or Turkic paternal ancestry isn't "hiding" in Poland under all that R1a1a.
The most common Y-DNA haplogroup among Mongolians and their close ethnic kin is C3. There's actually a particular lineage of C3 called the "star-cluster chromosome" which pops up regularly in purported descendents of the infamous Mongolian warlord Genghis Khan. This might mean that it's a marker of paternal ancestry from Genghis himself, which has been suggested in several academic papers (7, 8, 9). In any case, the haplotype is considered to be very young, probably less than 1000 years, and widespread in areas of Asia where the Mongol hordes were most active during the early Middle Ages. Therefore, it seems to be an excellent signal of Mongolian genetic influence from this key period. Below is a map of its frequencies in a variety of Asian groups.
 However, this marker has never been recorded in Poland, where C3 itself is extremely unusual. Indeed, Derenko et al. conclude that based on the paucity of the "star-cluster haplotype" among ethnic Russians, the Mongol hordes of the Middle Ages didn't even leave a genetic imprint on European Russia.
It is known that the Mongol Empire expanded over a considerable part of Eastern Europe by 1248 due to the khan Batu’s conquests. Russian principalities were vassal states of the Mongol Empire until 1480. However, we found no genetic traces of the Mongol sovereignty over Russia (in the form of male lineages of the cluster of Genghis Khan descendants) in the Russian population.
Poles do sporadically carry East Eurasian-specific mtDNA (ie. maternal) lineages, and it was recently suggested by Mielnik-Sikorska et al. that some of these lineages (ie. C4a1a, G2a and D5a2a1a1) might "possibly reflect relatively recent contacts of Slavs with nomadic Altaic peoples" (10). However, the authors also note that these markers have a wide distribution across Eurasia and might actually represent prehistoric gene-flow between Asia and Europe.
In fact, ancient DNA results have recently revealed unexpected frequencies of East Eurasian-specific mtDNA haplogroups - including C1, C4a2, C5, D* and Z1a - in Northern and Eastern European remains from the Neolithic and Mesolithic (11, 12, 13, 14). The samples were always small, but nevertheless it's useful to note that the incidence of the eastern mtDNA lineages was much higher in these ancient samples than in any modern Eastern European populations west of the Volga. What this suggests is that the vast majority of East Eurasian ancestry in Europe might have arrived there thousands of years before the Mongol incursions, and much of it has been lost since then, rather than gained, due to continuous population movements from west to east across the continent.
To add another twist to the tale, it actually seems that all Europeans do show significant prehistoric East Eurasian genome-wide admixture, so perhaps it's only the ancient eastern mtDNA markers that have almost gone extinct? The topic has been now been discussed in a couple of papers, and apparently this admixture shows higher affinity to modern Amerindians than North or East Asians (15), which is very curious indeed. But the details are sketchy because the results so far have been based on DNA from modern samples, so hopefully we can learn more very soon thanks to analyses of genome-wide markers from prehistoric Eurasian remains. In any case, a group of Poles was featured in one of these papers, and this is how they compared to other Europeans in a formal mixture test with the ADMIXTOOLS software (16).
 The positions of the samples in the table are based on the "Sardinian" f3-statistic, which indicates the strength of the Amerindian-like admixture signal when Karitiana Indians and Sardinians are chosen as references. The results appear fairly random in some cases, and that's probably because they're skewed by such factors as genetic drift and sample size - for instance, heavy drift might dampen the signal, while a larger sample size might increase it. But the outcomes are also clearly influenced by relatively recent admixture from Siberia, Central Asia and/or the Indian subcontinent. That's because the samples known to carry such admixtures, like the HGDP Russians and Turks, are at the top of the table. Therefore, it's worth noting that the Polish sample is found at the bottom, which is in line with results from all the other analyses presented above.
Please note that the information in this post pertains to the current Polish population by and large, and to individuals with all grandparents of ethnic Polish origin. It's not relevant to individuals whose recent ancestors came from within the borders (or former borders) of Poland but their ethnic origins were uncertain. Keep in mind that Poland was not as ethnically or genetically homogenous before World War II as it is today. Also worth noting is that in a country of almost 40 million people, some individuals will have very atypical pedigrees, and it might even be possible to find someone with, say, Papuan ancestry in Poland if we look hard enough.
By the way, I've no idea who made that meme at the top of the post, or where it was published originally, but I think it's very appropriate here. Please let me know if it violates any copyright laws and I'll take it down.
References...
1. Khrunin AV, Khokhrin DV, Filippova IN, Esko T, Nelis M, et al. (2013) A Genome-Wide Analysis of Populations from European Russia Reveals a New Pole of Genetic Diversity in Northern Europe. PLoS ONE 8(3): e58552. doi:10.1371/journal.pone.0058552
2. Morten Rasmussen et al., Ancient human genome sequence of an extinct Palaeo-Eskimo, Nature 463, 757-762 (11 February 2010) doi:10.1038/nature08835; Received 30 November 2009; Accepted 18 January 2010
3. Simon C Heath et al, Investigation of the fine structure of European populations with applications to disease association studies, European Journal of Human Genetics (2008) 16, 1413–1429; doi:10.1038/ejhg.2008.210
The positions of the samples in the table are based on the "Sardinian" f3-statistic, which indicates the strength of the Amerindian-like admixture signal when Karitiana Indians and Sardinians are chosen as references. The results appear fairly random in some cases, and that's probably because they're skewed by such factors as genetic drift and sample size - for instance, heavy drift might dampen the signal, while a larger sample size might increase it. But the outcomes are also clearly influenced by relatively recent admixture from Siberia, Central Asia and/or the Indian subcontinent. That's because the samples known to carry such admixtures, like the HGDP Russians and Turks, are at the top of the table. Therefore, it's worth noting that the Polish sample is found at the bottom, which is in line with results from all the other analyses presented above.
Please note that the information in this post pertains to the current Polish population by and large, and to individuals with all grandparents of ethnic Polish origin. It's not relevant to individuals whose recent ancestors came from within the borders (or former borders) of Poland but their ethnic origins were uncertain. Keep in mind that Poland was not as ethnically or genetically homogenous before World War II as it is today. Also worth noting is that in a country of almost 40 million people, some individuals will have very atypical pedigrees, and it might even be possible to find someone with, say, Papuan ancestry in Poland if we look hard enough.
By the way, I've no idea who made that meme at the top of the post, or where it was published originally, but I think it's very appropriate here. Please let me know if it violates any copyright laws and I'll take it down.
References...
1. Khrunin AV, Khokhrin DV, Filippova IN, Esko T, Nelis M, et al. (2013) A Genome-Wide Analysis of Populations from European Russia Reveals a New Pole of Genetic Diversity in Northern Europe. PLoS ONE 8(3): e58552. doi:10.1371/journal.pone.0058552
2. Morten Rasmussen et al., Ancient human genome sequence of an extinct Palaeo-Eskimo, Nature 463, 757-762 (11 February 2010) doi:10.1038/nature08835; Received 30 November 2009; Accepted 18 January 2010
3. Simon C Heath et al, Investigation of the fine structure of European populations with applications to disease association studies, European Journal of Human Genetics (2008) 16, 1413–1429; doi:10.1038/ejhg.2008.210
4. Esko et al., Genetic characterization of northeastern Italian population isolates in the context of broader European genetic diversity, European Journal of Human Genetics advance online publication 19 December 2012; doi: 10.1038/ejhg.2012.229
5. Peter A Underhill et al., Separating the post-Glacial coancestry of European and Asian Y chromosomes within haplogroup R1a, European Journal of Human Genetics advance online publication 4 November 2009; doi: 10.1038/ejhg.2009.194
6. Family Tree DNA R1a1a and Subclades Y-DNA Project
7. Derenko et al., Distribution of the Male Lineages of Genghis Khan’s Descendants in Northern Eurasian Populations, Russian Journal of Genetics, 2007, Vol. 43, No. 3; DOI: 10.1134/S1022795407030179
8. Zerjal et al., The Genetic Legacy of the Mongols, Am J Hum Genet. 2003 March; 72(3): 717–721. PMCID: PMC1180246
9. Abilev S. et al., The Y-chromosome C3* star-cluster attributed to Genghis Khan's descendants is present at high frequency in the Kerey clan from Kazakhstan, Hum Biol. 2012 Feb;84(1):79-89. doi: 10.3378/027.084.0106.
10. Mielnik-Sikorska M, Daca P, Malyarchuk B, Derenko M, Skonieczna K, et al. (2013) The History of Slavs Inferred from Complete Mitochondrial Genome Sequences. PLoS ONE 8(1): e54360. doi:10.1371/journal.pone.0054360
11. Zsuzsanna Guba et al., HVS-I polymorphism screening of ancient human mitochondrial DNA provides evidence for N9a discontinuity and East Asian haplogroups in the Neolithic Hungary, Journal of Human Genetics advance online publication 15 September 2011; doi: 10.1038/jhg.2011.103
12. Alexey G Nikitin et al., Mitochondrial haplogroup C in ancient mitochondrial DNA from Ukraine extends the presence of East Eurasian genetic lineages in Neolithic Central and Eastern Europe, Journal of Human Genetics advance online publication, 7 June 2012; doi:10.1038/jhg.2012.69
13. Lillie, Malcolm C et al., Prehistoric populations of Ukraine: Migration at the later Mesolithic to Neolithic transition, Population Dynamics in Prehistory and Early History (2012), Publication Date: July 2012, ISBN: 978-3-11-026630-6, DOI: 10.1515/9783110266306.93
14. Der Sarkissian C, Balanovsky O, Brandt G, Khartanovich V, Buzhilova A, et al. (2013) Ancient DNA Reveals Prehistoric Gene-Flow from Siberia in the Complex Human Population History of North East Europe. PLoS Genet 9(2): e1003296. doi:10.1371/journal.pgen.1003296
15. Lipson et al., Efficient moment-based inference of admixture parameters and sources of gene flow, arXiv:1212.2555v1 [q-bio.PE]
16. Patterson et al., Ancient Admixture in Human History, Genetics: Published Articles Ahead of Print, published on September 7, 2012 as 10.1534/genetics.112.145037
See also...
R1a and R1b from an early Mongolian tomb
I've just been sent a fascinating thesis on the mtDNA of Iron Age and Medieval samples from Poland. It suggests direct genetic continuity between Iron Age samples belonging to the Przeworsk and Wielbark Cultures, of what is now West and Central Poland, and present-day Poles. Here's the English summary, and a map of the sites under study:
For many years the origin of the Slavs has been the subject-matter in archaeology, anthropology, history, linguistics and recently also modern human population genetics. By now there is no unambiguous answer to a question where, when and in what way the Slavs originated. For the purposes of this dissertation, the analysis of ancient human mitochondrial DNA was applied. The ancient DNA was isolated from 72 specimens which came from Iron-Age and medieval graveyards from the area of current Poland. Ancient mtDNA was extracted from two teeth from each individual and reproducible sequence results were obtained for 20 medieval and 23 Iron-Age specimens. On the basis of HVR I mtDNA mutation motifs and coding region SNPs each specimen was assigned to a mitochondrial haplogroup. The obtained results were used together with other ancient and modern populations to analyse shared haplotypes and population genetic distances illustrated by multidimentional scaling plots (MDS). The differences on genetic level and quite high genetic distances (FST) between medieval and Iron-Age populations as well as significant number of shared informative haplotypes with Belarus, Ukraine and Bulgaria may evidence genetic discontinuity between medieval and Iron Ages. From the other side, the highest number of shared informative haplotypes between Iron-Age and extant Polish population as well as the presence of subhaplogroup N1a1a2, can confirm that some genetic lines show continuity at least from Iron Age or even Neolithic in the areas of present day Poland. The results obtained in this work are considered to be the first ancient contribution in genetic history of the Slavs.

Below is an MDS from the thesis, based on data corrected for the effects of potential relatives in the Iron Age sample. I don't think it's a particularly useful way of judging the intra-European affinity of the two ancient Polish groups, mostly because the samples are small, and contemporary North, Central and East Europeans don't differ very much in terms of mtDNA. Nevertheless, we can see that both the Iron Age (Okres Rzymski) and Medieval (Sredniowiecze) samples fall within the range of modern European mtDNA diversity. On the other hand, the German Neolithic LBK sample (Neolit LBK Niemcy) clearly does not, because it's sitting at the far right of the plot, away from the main European cluster. This dichotomy between the genetic structure of the LBK farmers and modern Europeans has been demonstrated in previous studies, but the reasons for it are still a mystery.
Interestingly, modern Poles are closer to an Iron Age sample from Denmark (Okres Zelaza Dania) than to the Polish Iron Age set. However, as per the summary above, the author also compared the frequencies of the most informative haplotypes among the modern and ancient samples, and found that extant Poles are the closest group to the Polish Iron Age remains, followed by Balts, Swedes and Baltic Finns. Below is a table showing those results.
According to the author, these matches might hint at Baltic, Germanic and Finno-Ugric influences in the Polish Iron Age population. Perhaps, but in my opinion, they're simply in line with geography, and reflect the general North European character of maternal lineages shared by populations from around the Baltic, both today and during the Iron Age.
The results for the Medieval Polish sample are more intriguing, because they're somewhat out of whack with geography. Its best matching modern groups are Belorussians, Ukrainians and Bulgarians. This might suggest that, during the early middle ages, the territory of present day Poland experienced an influx of groups from what are now Belarus and Ukraine, who then melted into the gene pool of the natives of Polish Iron Age descent. However, conversely, it might mean that Belorussians, Ukrainians and Bulgarians descend in large part from fairly specific medieval groups from the area of modern Poland.
In any case, whether present day Polish territory saw some migrations from the immediate east during the Medieval period or not, this preliminary look at ancient Polish mtDNA suggests long-standing genetic continuity in the region. What it clearly doesn't show is a complete, or almost complete, population replacement in the areas between the Oder and Bug rivers during the migration period.
Indeed, the thesis results put into doubt past notions that the Przeworsk and Wielbark cultures were of Germanic origin.
The (mtDNA) haplogroup missing from both the Iron Age and medieval samples from the territory of modern Poland was haplogroup I. In contemporary Slavic populations, this haplogroup is found at levels ranging from 1.2% in Bulgarians to 4.8% in Slovaks. It was also recorded at high levels in ancient remains from Denmark. It showed a frequency of 12.5% in an Iron Age sample, and 13.8% in a medieval sample. Melchior et al. 2008 suggest that haplogroup I might have been more common in Denmark and Northern Europe during that period. Therefore, the lack of this haplogroup in ancient DNA from the territory of modern Poland, might mean that the Przeworsk and Wielbark cultures should not be identified with Germanic populations.
I'm sure more ancient DNA studies are on the way looking at the origins of Slavs and Poles. Indeed, if the Y-chromosomes of Przeworsk and Wielbark remains are successfully tested, I won't be surprised if they look fairly typical of modern Poles, with a decent representation of R1a1a-M458, which is the most common Y-chromosome haplogroup in Poland today.
Anna Juras, Etnogeneza Słowian w świetle badań kopalnego DNA, Praca doktorska wykonana w Zakładzie Biologii Ewolucyjnej Człowieka Instytutu Antropologii UAM w Poznaniu pod kierunkiem Prof. dr hab. Janusza Piontka
This is a continuation of my ChromoPainter analysis of Europeans from north of the Pyrenees, Alps and Balkans (see here). To obtain the most accurate results possible on my laptop, I increased the burn-ins and iterations in fineSTRUCTURE to 500K each (5 hour run in all, which is all I'm willing to put this machine through). The end product looks very similar to my initial analysis, in which I explored the data at 200K burn-ins and iterations. What I think this shows is that the results are robust, and I doubt they'd change much even after a couple of days of running fineSTRUCTURE.
Indeed, as mentioned in my previous blog entry, this appears to be the most detailed and accurate cluster analysis of this part of Europe produced anywhere to date. There are 21 clusters in all, with at least 20 looking like strong signals of genetic substructures across North, West, Central and East Europe (see spreadsheet for individual classifications). They include:
pop0 - West Finnish1: This is a pair of reference individuals, most likely from Western Finland, judging by their PCA and ADMIXTURE results. They are either from the same community, or have a very similar mix of very specific ancestries.
pop1 - Erzya + Moksha: This includes all of the Erzya and Moksha in the project, plus a Russian with recent Erzya ancestry. It's closely related to ethnic Russian clusters that stretch from Northwest Russia to near the Volga, and also to the Estonian cluster.
pop2 - South/Central Finnish: This is the largest Finnish cluster, and that's probably more than just the result of sampling bias. I would say that the greater part of the Finnish population would belong to this type of cluster, which occupies regions of highest population density within the country.
pop3 - Fenno-Scandian: This cluster includes a Northern Swede, a Swede with probable recent Finnish ancestry, and Finns with probable recent Swedish influence. I have a feeling that Finland Swedes and Aland Islanders would also be placed here more often than not.
pop4 - Northwest Russian/Southeast Finnish: Although this cluster includes only two individuals, it's definitely much more than just the result of two relatively closely related samples being in the same run. I'd hazard a guess that Northwest Russians with, say, significant Ingrian ancestry, would land here, and so would Finns with recent Russian ancestry.
pop5 - West Finnish2: Based on PCA and ADMIXTURE results, most of these Finns likely come from Western Finland, probably from places like Southern Ostrobothnia. They possibly also have some Swedish influence.
pop6 - West German: This cluster is based on individuals from Western and Northwestern Germany. It also includes a Dutchman, Austrian and people of mixed origin, like a Dane with French and German ancestry, and Americans with British, German, Scandinavian and/or Polish ancestry. In other words, this is where Northwestern Europe meets Central Europe.
pop7 - Vologda Russian: Most of the Vologda Russians from the HGDP land here, so this appears to be a local cluster. Judging from its phylogeny, it looks like a mix of North Slavic, Baltic and Finnic influences.
pop8 - East Finnish: All the project and reference Finns with substantial ancestry from new settlement areas of Eastern Finland appear in this cluster. No wonder then, that this is the cluster with the highest chunk count in this analysis.
pop9 - Estonian: This is a mixed cluster, including individuals from Estonia, and, as far as I know, Russians with substantial ancestry from near Estonia. As mentioned above, it's closely related to the Erzya + Moksha, Northwest Russian and Vologda clusters. However, it's clearly much more western than any of these clusters (for instance, see the PCA below), which suggests Germanic influence in its makeup.
pop10 - Cornish: Almost all of my Cornish samples from the 1000 Genomes Project feature in this very local cluster, which shows the highest chunk count among the Western European samples. The overall results suggest a lack of outbreeding in recent times.
pop11 - French/Belgian: Interestingly, this cluster includes the bulk of the French samples, a French Canadian, and two Belgians. On the other hand, the most northerly French are placed in the more cosmopolitan Northwest European cluster (see below).
pop12 - Lithuanian: All of the more or less pure Lithuanians fall in this cluster. Those that don't are a reference sample from Behar et al. 2009, who always appears very Belorussian like in other analyses, and here sits in the East Slavic cluster, and a project member with recent German ancestry (LIT3). The Western European influence carried by the latter pushes him into the Polish/West Ukrainian cluster, despite not having any documented Polish or Ukrainian ancestry.
pop13 - Northwest Russian: This cluster appears to be made up of Russians who have more Finnic, and/or perhaps Eastern Baltic, ancestry than the individuals in the East Slavic cluster. In other words, it's more northerly, less westerly, and more closely related to the Finnic-speaking Erzya, Moksha and Estonians.
pop14 - Irish + West British: Most Irish individuals fall in this cluster, as well as British samples from Western Scotland and Wales. It's tempting to correlate this cluster with Celtic genetic ancestry in the Isles.
pop15 - South/West Scandinavian: This is basically a Norwegian and Southern Swedish cluster. It also features Swedes from other parts of the country who most likely have some German, Walloon and/or French influence.
pop16 - East German: This cluster includes individuals with significant or even overwhelming Germanic ancestry, but also with very clear Western Slavic input. One of the individuals here is of mixed Polish, German and Swedish ancestry, which pretty much sums up the character of this cluster in a modern context. The presence of two Hungarians from Behar et al. 2009. isn't surprising, because Hungary was settled by both Germanic and Western Slavic groups from the early Middle Ages until modern times.
pop17 - Northwest European: I had reasonable hopes of breaking up this large cluster into a couple of units at least. However, that did not happen, and I don't think it will unless I obtain more samples from the relevant areas of Europe, like Holland and specific parts of the UK. I think the main reason this cluster failed to budge was because of its cosmopolitan nature. In other words, the samples here include some of the most outbred in the analysis, and this, coupled with the fact that they carry very similar ancestral components, means that fineSTRUCTURE doesn't have anything to latch onto to create divisions.
pop18 - East Scandinavian: This could also be called a Swedish cluster. It's almost entirely made up of Swedes, usually from Eastern or Southeastern Sweden, and/or occasionally with recent Finnish influence.
pop19 - Polish/West Ukrainian: The vast majority of the Poles fall in this cluster, and about half of the Ukrainians from Yunusbayev et al. 2011. Most of these Ukrainians appear to be from the Lviv district in the west, and some might even have fairly recent Polish and/or German ancestry. In fact, I would say the latter is a good bet for UkrLv240Y, who shows large Western European segments on several chromosomes.
pop20 - East Slavic: All of the Belorussians cluster here, and so do Russians from near Belorussia and Ukraine, and almost half of the Ukrainians from Yunusbayev et al. 2011 (those who show more easterly genetic characteristics). An individual of mixed Polish and Lithuanian ancestry also makes an appearance here, suggesting that one of the main factors differentiating this cluster from the Polish/West Ukrainian group is a higher level of Baltic admixture in the former.
pop21 - East Central European: This cluster is based on most of the Hungarians in my dataset, but it also includes a number of Western and Southern Slavs, often with significant German ancestry. Not surprisingly, this cluster shows very high affinity with both the East German and Polish/West Ukrainian clusters.
Let's now move on to some graphics. Below, in order of appearance, are the following: raw data coancestry matrix, showing the placement of individual samples; aggregate coancestry matrix, showing the populations (or clusters) described above; pairwise coincidence matrix, which is useful for spotting very recent ancestral ties; a PCA plot of the 21 clusters. More detailed ChromoPainter/fineSTRUCTURE PCAs of Western Europe can be found at this link.


 Finally, those of you who wish to run your own experiments with the ChromoPainter datasheets from this analysis can download them here. Please note, the sheets don't reveal any raw or traits/disease data.
I have some preliminary results from a new intra-North Euro cluster analysis, using a cutting edge tool called ChromoPainter. More than 400 samples and 270K SNPs were tested, in linkage mode, and then the output processed in fineSTRUCTURE at 200K burn-ins and iterations. Like I say, the results should be treated as preliminary, but they already look better than any other cluster analysis I've ever seen dealing with Europe north of the Alps, Pyrenees and Balkans. The algorithm identified 21 clusters, with most located in Eastern and Northeastern Europe (see spreadsheet for details). Below are two plots showing how the clusters relate to each other via a tree diagram and heat maps – the first shows an aggregate view, and the second the individual samples.


It's interesting that the Baltic Finns seem to create clusters at a drop of a hat, but they also share the highest number of chunks, and the longest chunks, than any other group. Indeed, all of the Finnish clusters are closely related, and many of the individuals, especially from East Finland, even look like distant relatives on the heat map (note the ultra-hot, blue squares). On the other hand, the large Northwestern European cluster, featuring samples from across the UK, as well as from several nearby countries, is holding firm, and might be tough to break up in this analysis.
I have some theories about the reasons for the obvious genetic homogeneity and diversity in Western Europe, and these include the effects of the Black Death. It decimated many populations in the western half of the continent, thus encouraging migrations into emptied areas, and eventually leading to more open, mobile societies. It's an interesting subject, and I might write much more on it in the future. Meantime, here's a PCA plot from the ChromoPainter chunk counts data. Note the large distances spanned by groups from Northern and Eastern Europe, and the tight bundle of samples from the west, mostly from the UK, Ireland, France and the Low Countries. Interestingly, and perhaps counter-intuitively, it's the closely related Finns who take up most of the space on the plot.

The first component picked up by this PCA appears to be an Atlantic one. It peaks among the Cornish samples, but shows similar levels in all the British, Irish, French, Dutch and Belgians (post-Black Death mobility?). If we are to assume that I identified the component correctly, then it appears as if the East Finns, Vologda Russians, Erzya from the Middle Volga, and Lithuanians are the least “Atlantic” samples in this analysis. These groups, especially the East Finns, also happen to act like relative genetic isolates in many of my experiments (such as ADMIXTURE and MDS analyses). Thus, it seems they've been sheltered from significant gene flow from outside in recent times, including from the west, like German emigration to East Central Europe and Scandinavian influence in Western and Southwestern Finland.
One of the biggest hits of the year for this blogger was the discovery of Y-DNA haplogroup R1a among three Corded Ware skeletons from a burial site in Eulau, eastern Germany. It's an important result, because it links one of Europe's most dominant Y-haplogroups to a major Late Neolithic archeological complex.
All three individuals were confirmed to be paternally related via their shared Y-STR haplotype. Nevertheless, the outcome appears far from a random coincidence. Consider that in Europe today R1a shows its highest frequencies in Poland and Western Russia, which are both located in former Corded Ware territory, and where the Eulau R1a haplotype appears to have its closest modern matches. Moreover, the Corded Ware culture is often classified as an Indo-European culture by archeologists and linguists, while at the same time R1a has been posited as a marker of the early Indo-Europeans by some geneticists. Needless to say, I'm expecting R1a to be a common, and perhaps dominant marker among Corded Ware samples when more of them make it to the lab.
The consensus haplotype of the three individuals (based on most complete profile) gave two exact matches in in an European population sample of 11,213 haplotypes in a set of 100 populations (as of July 2008, Release ‘‘23’’ from 2008–01-15 14:44:25): one individual from Poland (1/939 from Gdansk) and one from Russia (1/48 from Tambov).
...
The Y haplotype was predicted using the Web-based program Haplotype Predictor (9). The three individuals of grave 99 belong to
haplotype R1a, with a probability of 100% based on the Y-STR profile of individual 3 (10). To confirm haplogroup status, we
further amplified an 85-bp fragment covering the Y-SNP marker SRY10831.2 characteristic for R1a (11). Primer sequences are
given in Table S6. Sequences and sequenced clones from independent extract of all three individuals show the specific G to A transition identifying R1a (Fig. S5).
The mitochondrial DNA (mtDNA) lineages of the Eulau skeletons belonged to haplogroups K1b (3), X2 (2), H, I, K1a2, and U5b. Most of these maternal markers aren't particularly common in Europe today, and the overall result appears decidedly unusual compared to the mtDNA frequencies of modern European populations, largely because of the low frequency of H.
I'm quite certain this is at least partly due to the small sample size and presence of several related individuals skewing some of the frequencies. However, it's interesting to note that this pattern of discontinuity between mtDNA gene pools from different time periods has also been reported in other studies, some with larger samples, and focusing on different regions of Europe. So it might well be a signal of significant shifts in mtDNA frequencies during European prehistory and early history, possibly as a result of major migrations leading to significant population replacements.
Interestingly, one of the ancient K1b lineages most closely matched a haplotype shared by two modern Shugnans from Tajikistan. Exactly how the Corded Ware individual is related to these two Central Asians isn't clear yet, but Shugni is an Indo-Iranian language, so some kind of early Indo-European relationship is possible.
Citation...
Wolfgang Haak et al, Ancient DNA, Strontium isotopes, and osteological analyses shed light on social and kinship organization of the Later Stone Age, PNAS, Published online before print November 17, 2008, doi:10.1073/pnas.0807592105